
Отчёт Динамика сделок показывает изменения статусов сделок за определённый период с учётом выбранной воронки и ответственного сотрудника.
начало внимание
Страница Динамика сделок доступна при активации одного из платных решений CRM, включающего формирование отчётов. Работать с ней смогут только пользователи, у которых есть лицензия такого решения.
конец внимание
Чтобы сформировать отчёт:
- Перейдите в раздел CRM и откройте страницу Динамика сделок.
- Выберите:
- период, за который нужно настроить отчёт;
- воронку;
- сотрудника, ответственного за сделки в указанной воронке. Если поле Ответственный оставить пустым, отчёт сформируется по всем сотрудникам.
- Вы можете добавить поля из контекста приложения Сделка.
- Чтобы отобразить в отчёте удалённые сделки, включите опцию Показывать удалённые.
- Нажмите кнопку Построить.
Как настроить дополнительные поля для отчёта
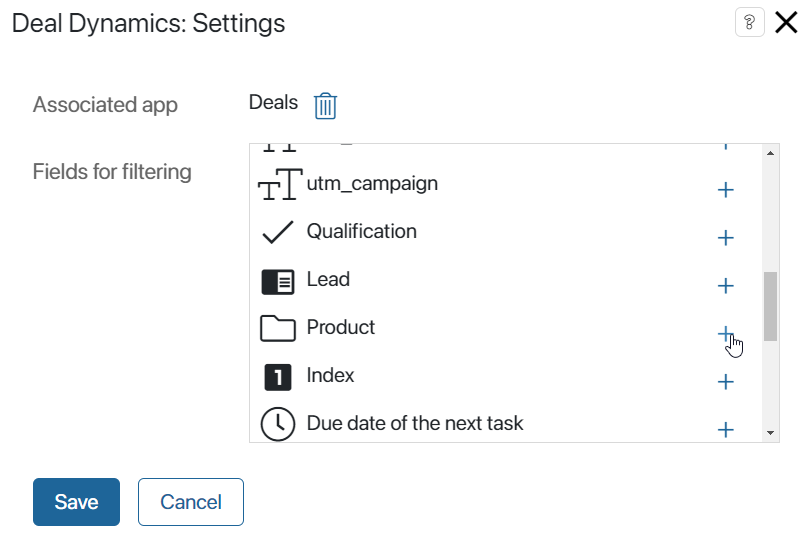
Вы можете добавить поля для фильтрации данных в отчёте, используя свойства контекста приложения Сделка. Для этого:
- Проверьте, что для выбранных свойств включена опция Поиск и сортировка по полю.
- В настройках страницы Динамика сделки нажмите Редактировать и выберите дополнительные поля для фильтрации.
Теперь в качестве исходных данных для отчёта можно указать не только период, воронку и ответственного, но и значения добавленных полей.
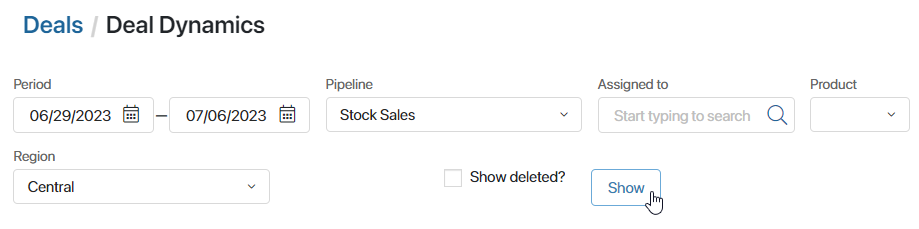
Рассмотрим пример. Допустим, на карточку сделки добавлены поля Продукт и Регион. Если вы хотите получать отчёт о сделках по определённому продукту и региону, выполните следующие действия:
- В контексте приложения Сделка для свойств Продукт и Регион включите опцию Поиск и сортировка по полю.
- В настройках страницы Динамика сделки нажмите Редактировать и выберите дополнительные поля.
Теперь на странице отчёта отобразятся поля Продукт и Регион, в которых можно выбрать нужные значения. Так, указав вводные данные, приведённые в примере ниже, вы получите выборку только тех сделок за период 23-30.09.2022 из Воронки продаж, в карточках которых в поле Регион указано значение Центральный.
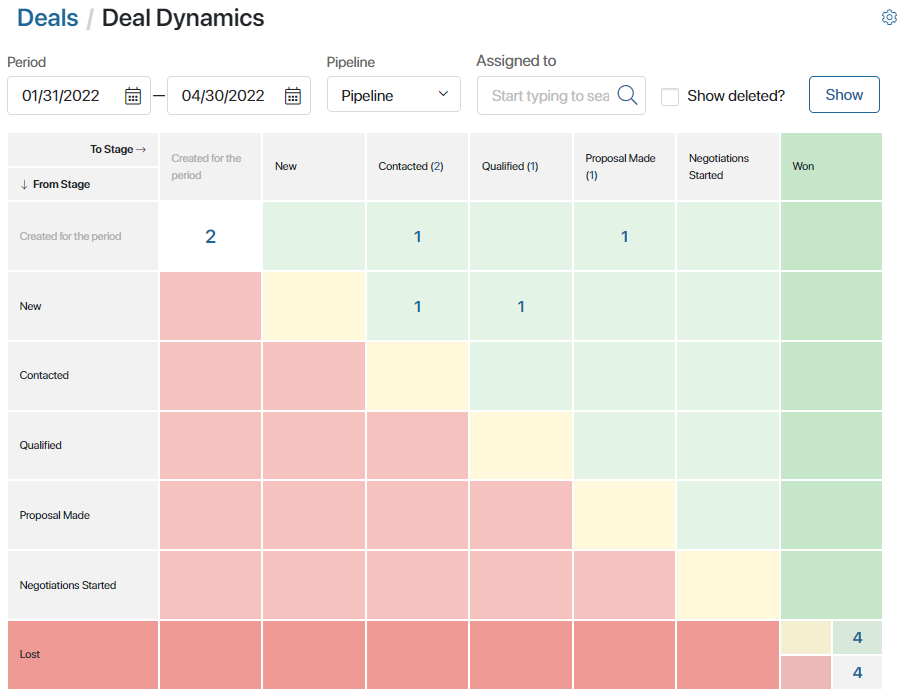
Как читать отчёт
Названия строк и колонок в отчёте соответствуют стадиям выбранной воронки продаж. Названия строк показывают стадии, в которых сделка находилась на начало периода, а названия столбцов – стадии, в которых сделка находится на конец указанного периода. Динамика сделок в отчёте показана цветом.
В белой ячейке вы можете увидеть общее количество сделок, добавленных в эту воронку продаж в указанный период. Кроме того, здесь отобразятся сделки, которые перемещались между этой и другими воронками в выбранном периоде. Сделки, закрытые с неуспехом, здесь отображаться не будут.
На зеленом фоне показаны сделки с положительной динамикой — то есть те, которые за указанный период продвинулись вперед.
На светло-красном фоне вы можете увидеть сделки с отрицательной динамикой – то есть те, которые вернулись на один из предыдущих этапов.
По диагонали на желтом фоне отображаются сделки, которые находятся без движения в указанном периоде. Это те сделки, которые на дату начала и на дату окончания периода находятся в одной и той же стадии.
В правом нижнем углу отчёта показывается общая статистика за период:
- в зеленой ячейке отображается количество сделок с положительной динамикой;
- в красной — количество сделок с отрицательной динамикой, включая неуспешные сделки;
- в желтой — количество сделок, которые находятся без движения;
- в серой ячейке отображается общее количество сделок, которые попали в отчёт в указанном периоде.
Если нажать на одно из чисел в отчёте, в открывшемся окне вы увидите подробную информацию о каждой сделке на выбранной стадии.

Чтобы перейти на карточку сделки, нажмите на её название.
Видимость отчёта
Вы можете ограничить круг сотрудников, которые имеют доступ к отчёту Динамика сделок. Для этого настройте его видимость. Нажмите на иконку ![]() справа от его названия и выберите пункт меню Видимость страницы.
справа от его названия и выберите пункт меню Видимость страницы.
В появившемся окне укажите группы пользователей, например, Руководители. Только эти сотрудники будут видеть Динамику сделок в левом меню раздела CRM.
