
Отчёт предназначен для анализа работы вашего чат-центра. С его помощью вы можете проверить эффективность операторов и каждой линии, а также посмотреть объём поступающих обращений.
Чтобы перейти к отчётам, выберите соответствующий пункт в меню раздела Линии.
По умолчанию на странице расположены две категории отчётов:
- Эффективность операторов — отчёты этой категории представляют собой графики, на которых отображаются индивидуальные показатели работы операторов на линии. Доступны три вида отчётов:
- Скорость ответа — средняя скорость ответа операторов, работающих на линии;
- Время ожидания — максимальное время ожидания клиента между ответами оператора;
- Длительность сессии — средняя продолжительность сессии до её закрытия.
- Эффективность линий — в этой категории отчётов отображается общая эффективность и загрузка линий. Доступны следующие отчёты:
- Скорость первого ответа — усреднённое время между взятием сессии в работу и ответом на сообщение клиента;
- Доля ответов бота — процент ответов бота в сессиях;
- Обработанные обращения — общее количество принятых и обработанных обращений на линии. Отображается в виде графика.
Каждый отчёт отображается на странице с помощью виджета Отчёт по Линиям. Вы можете настроить страницу, изменив расположенные по умолчанию виджеты или добавив новые. Для этого перейдите в дизайнер интерфейсов, нажав на значок ![]() рядом с названием страницы и выбрав пункт Конструктор.
рядом с названием страницы и выбрав пункт Конструктор.
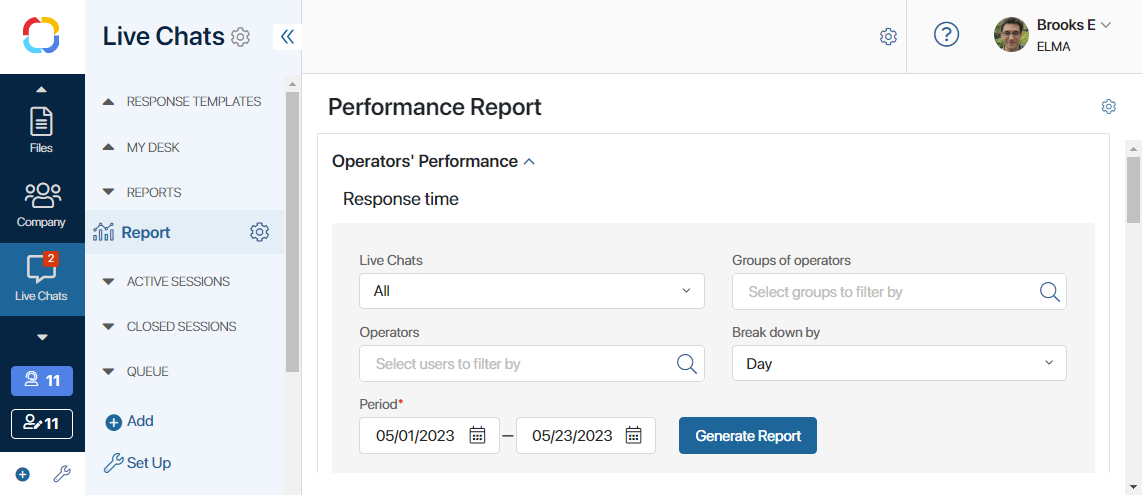
Построение отчёта
Выберите нужный вам отчёт и заполните поля.
Все отчёты на странице имеют одинаковый набор полей:
- Линии — выберите линию, по которой будет строиться отчёт. При выборе опции Все отчёт построится по всем настроенным линиям;
- Группы операторов — нажмите на значок
 и выберите из списка группу операторов, по которой выведутся показатели отчёта. Данное поле не обязательно для заполнения;
 - Каналы — нажмите на значок и выберите подключённый к линии канал связи, например, Telegram, по сессиям из которого будет строиться отчёт. Это поле не обязательно для заполнения;
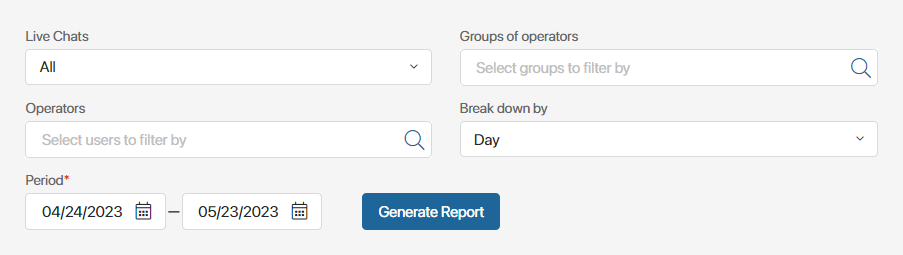
- Операторы — нажмите на значок и выберите из списка одного или нескольких операторов, по которым будет строиться отчёт. Данное поле не обязательно для заполнения;
- Детализация — степень детализации графика в отчёте. Доступны значения: День, Неделя, Месяц. Например, если вы выберете опцию Месяц, а в календаре введёте даты с 1 января до 1 апреля, то на гистограмме вы увидите 4 столбца с данными. Если вы выберете опцию Неделя, данные будут разбиты по неделям в рамках указанных дат. Данное поле отображается в отчётах, содержащих графики;
- Период* — введите вручную или укажите с помощью календаря отчётный период.
После заполнения полей нажмите кнопку Сформировать отчёт. На странице отобразится построенный по указанным параметрам отчёт.
Обратите внимание, в отчёте не отобразятся данные по сессиям, отмеченным как спам.
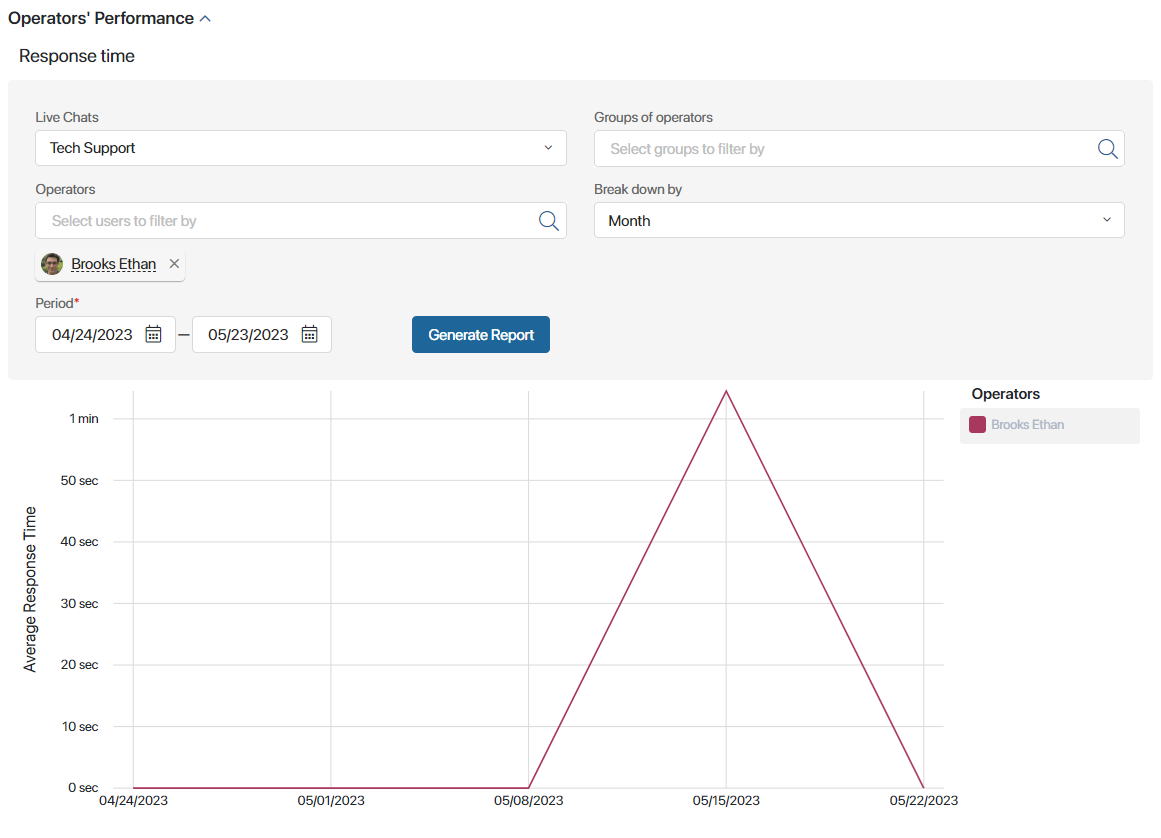
Чтобы посмотреть более точные показатели по каждому столбцу графика, наведите на него курсор.