
Виджет используется для построения отчёта в разделе Линии. С помощью виджета вы можете проанализировать работу вашего чат-центра — проверить эффективность операторов и линий, посмотреть объём поступающих обращений и т. д.
Добавление виджета
Чтобы разместить виджет на странице, перетащите его с правой панели дизайнера интерфейсов на поле для моделирования или нажмите кнопку +Виджет. Подробнее о добавлении виджетов читайте в статье «Добавить виджет на страницу».
В открывшемся окне выполните настройку.
Вкладка «Основные»
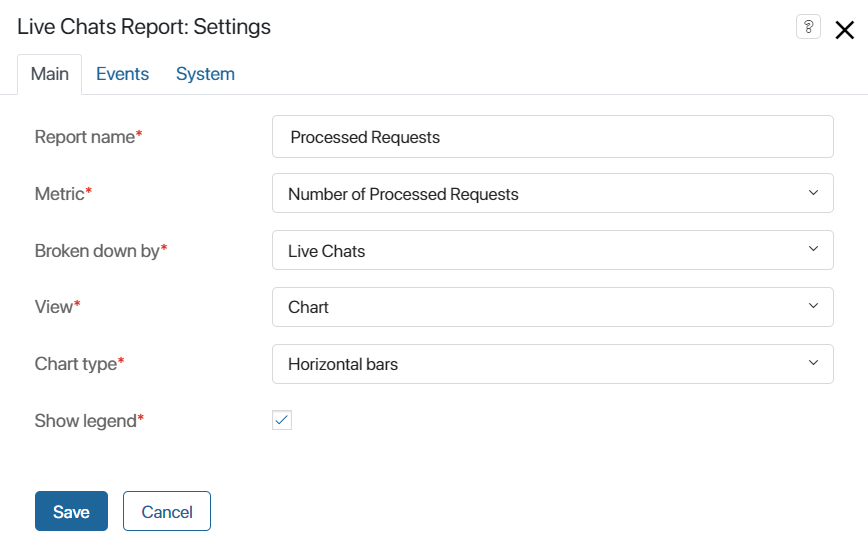
- Название отчёта* — укажите название отчёта, которое будет отображаться в его заголовке;
- Метрика* — из раскрывающегося списка выберите метрику, по которой будет строиться отчёт:
- Средняя скорость ответа — средняя скорость ответа операторов, работающих на линии;
- Максимальное время ожидания — время ожидания клиента между ответами оператора;
- Средняя скорость первого ответа — усреднённое время между взятием сессии в работу и ответом на сообщение клиента;
- Доля ответов бота — процент ответов бота в сессиях;
- Средняя длительность сессии — средняя продолжительность сессии до её закрытия;
- Количество обработанных обращений — общее количество принятых и обработанных обращений на линии;
- Разрез* — из раскрывающегося списка выберите параметр, в разрезе которого будет строиться отчёт. В зависимости от выбранной метрики могут быть доступны варианты: Операторы, Группы операторов, Линии или Вся компания;
- Представление* — выберите, в каком виде будет формироваться отчёт: графиком или таблицей;
- Тип графика* — поле появляется при выборе представления График. Из раскрывающегося списка выберите тип графика: столбчатый вертикальный, столбчатый горизонтальный, линейный или круговой;
- Показывать легенду* — поле появляется при выборе представления График. Отметьте опцию, чтобы рядом с графиком отображалось значение, выбранное в поле Метрика*;
- Группировать также по* — поле появляется при выборе представления Таблица, а также если в поле Разрез указано значение Операторы или Группы операторов. Нажмите на плюс, чтобы выбрать из списка свойства по которым будут группироваться данные в таблице.
Вкладки «События» и «Системные»
На этих вкладках задаются системные настройки, одинаковые для всех виджетов. Они позволяют управлять видимостью виджетов и доступом к ним, настраивать их поведение при наведении курсора и т. д. Подробнее об этом читайте в статье «Системные настройки виджетов».
Для завершения настройки виджета нажмите кнопку Сохранить.
Чтобы настроенная страница стала доступна пользователям, нажмите Сохранить и Опубликовать на верхней панели дизайнера интерфейсов.