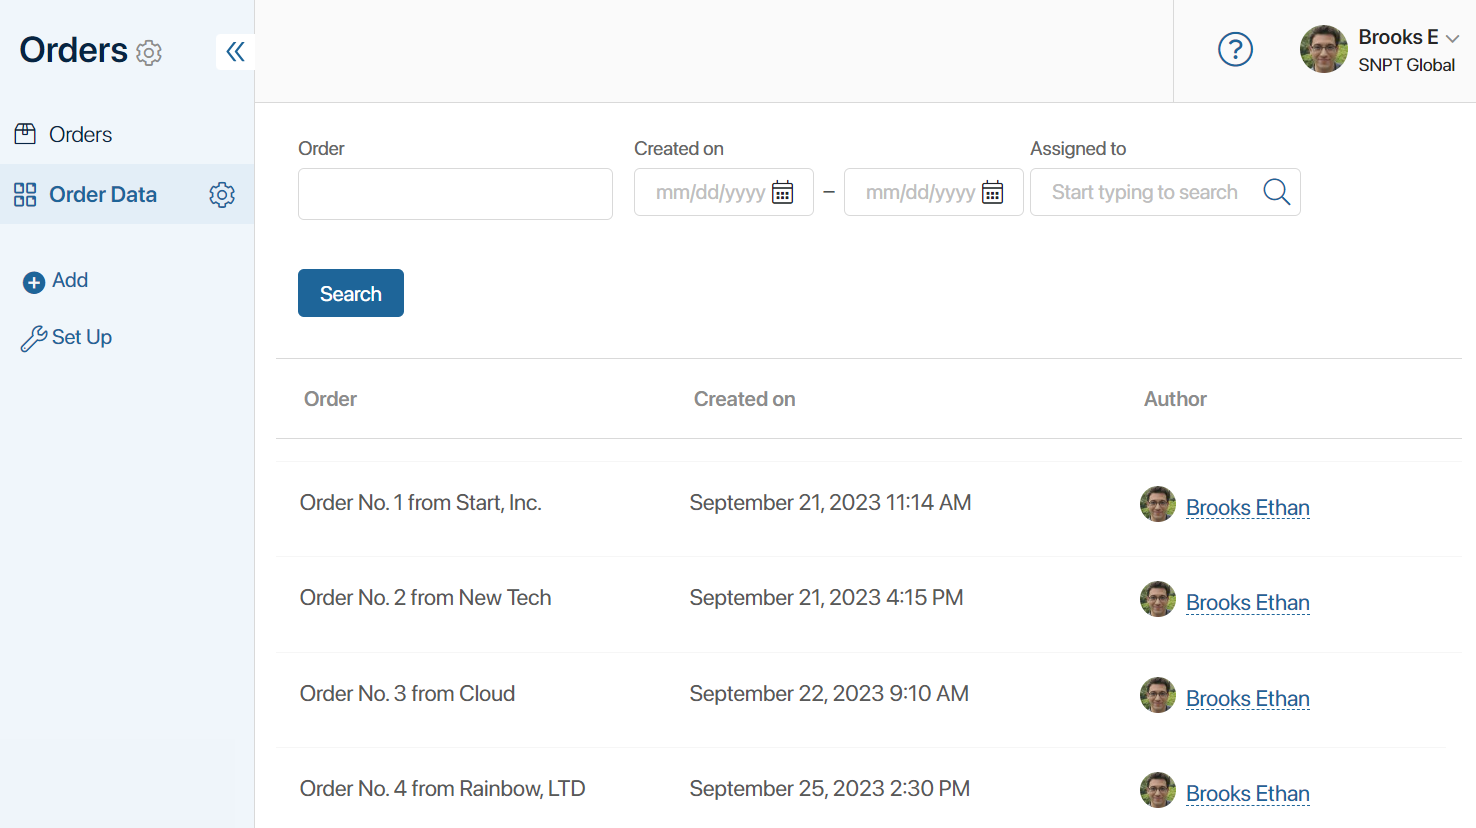
A report is a monitor tool that gathers data from multiple apps and displays it in the form of a table.
Apps added to a report are called data sources. During report configuration, fields that will be displayed as table columns are selected from these sources.
Sources are linked with each other using a common field. You can choose the type of binding, and setting conditions for which items of the source apps are filtered and included in the report.
For example, you can create a report that displays information from two source apps: Orders and Invoices. To do this, add a common field to both sources, such as Contract with the App type. Then select the app properties that will be shown in the table. Bind the sources using the common field and set data filtering conditions. You can choose to display all orders and invoices or exclude items with an empty Contract field. After saving the settings, the table will show aggregated information from the source apps.
In this way, data from multiple apps can be sorted and viewed in a single interface.

Report features
- A report is created in a workspace and functions like a regular app. You can configure the report visibility for specific user groups in the workspace left menu.
- In a report, you can add several data source apps. These can be custom apps or built-in apps of the Standard, Event, or Document types from any workspace.
- Sources are linked in pairs using properties from their context, for which the search and sort option is enabled. There are two methods used to link them:
- A common field with the same data type is added to the context of both sources.
- In one source’s context, there is an App type field that references the second source.
- When connecting sources, one or multiple data filtering conditions can be established. For example, you can choose to display all information from the sources or exclude items with empty values in the common field.
- If the search and sort option is enabled for a source property, a search filter is created on the report page after it is added to the table. In addition, the data in the table is sorted by clicking on the column name.
- Data from the report can be retrieved by creating API requests and can be accessed in scripts using TS SDK methods.
- Data from the report can be exported to a .xlsx file using custom table export templates.
- To visualize data from the report, you can create charts or tables based on it.
- You can add a link to app forms and pages that will open the specified report when you click on it. For this purpose, a field of the Report type is created in the interface designer.
Read more about reports in the following articles:
- Create and configure a report
- Add sources and set up the report table
- Bind report source apps
- Export report data
- Report customization example
Found a typo? Highlight the text, press ctrl + enter and notify us